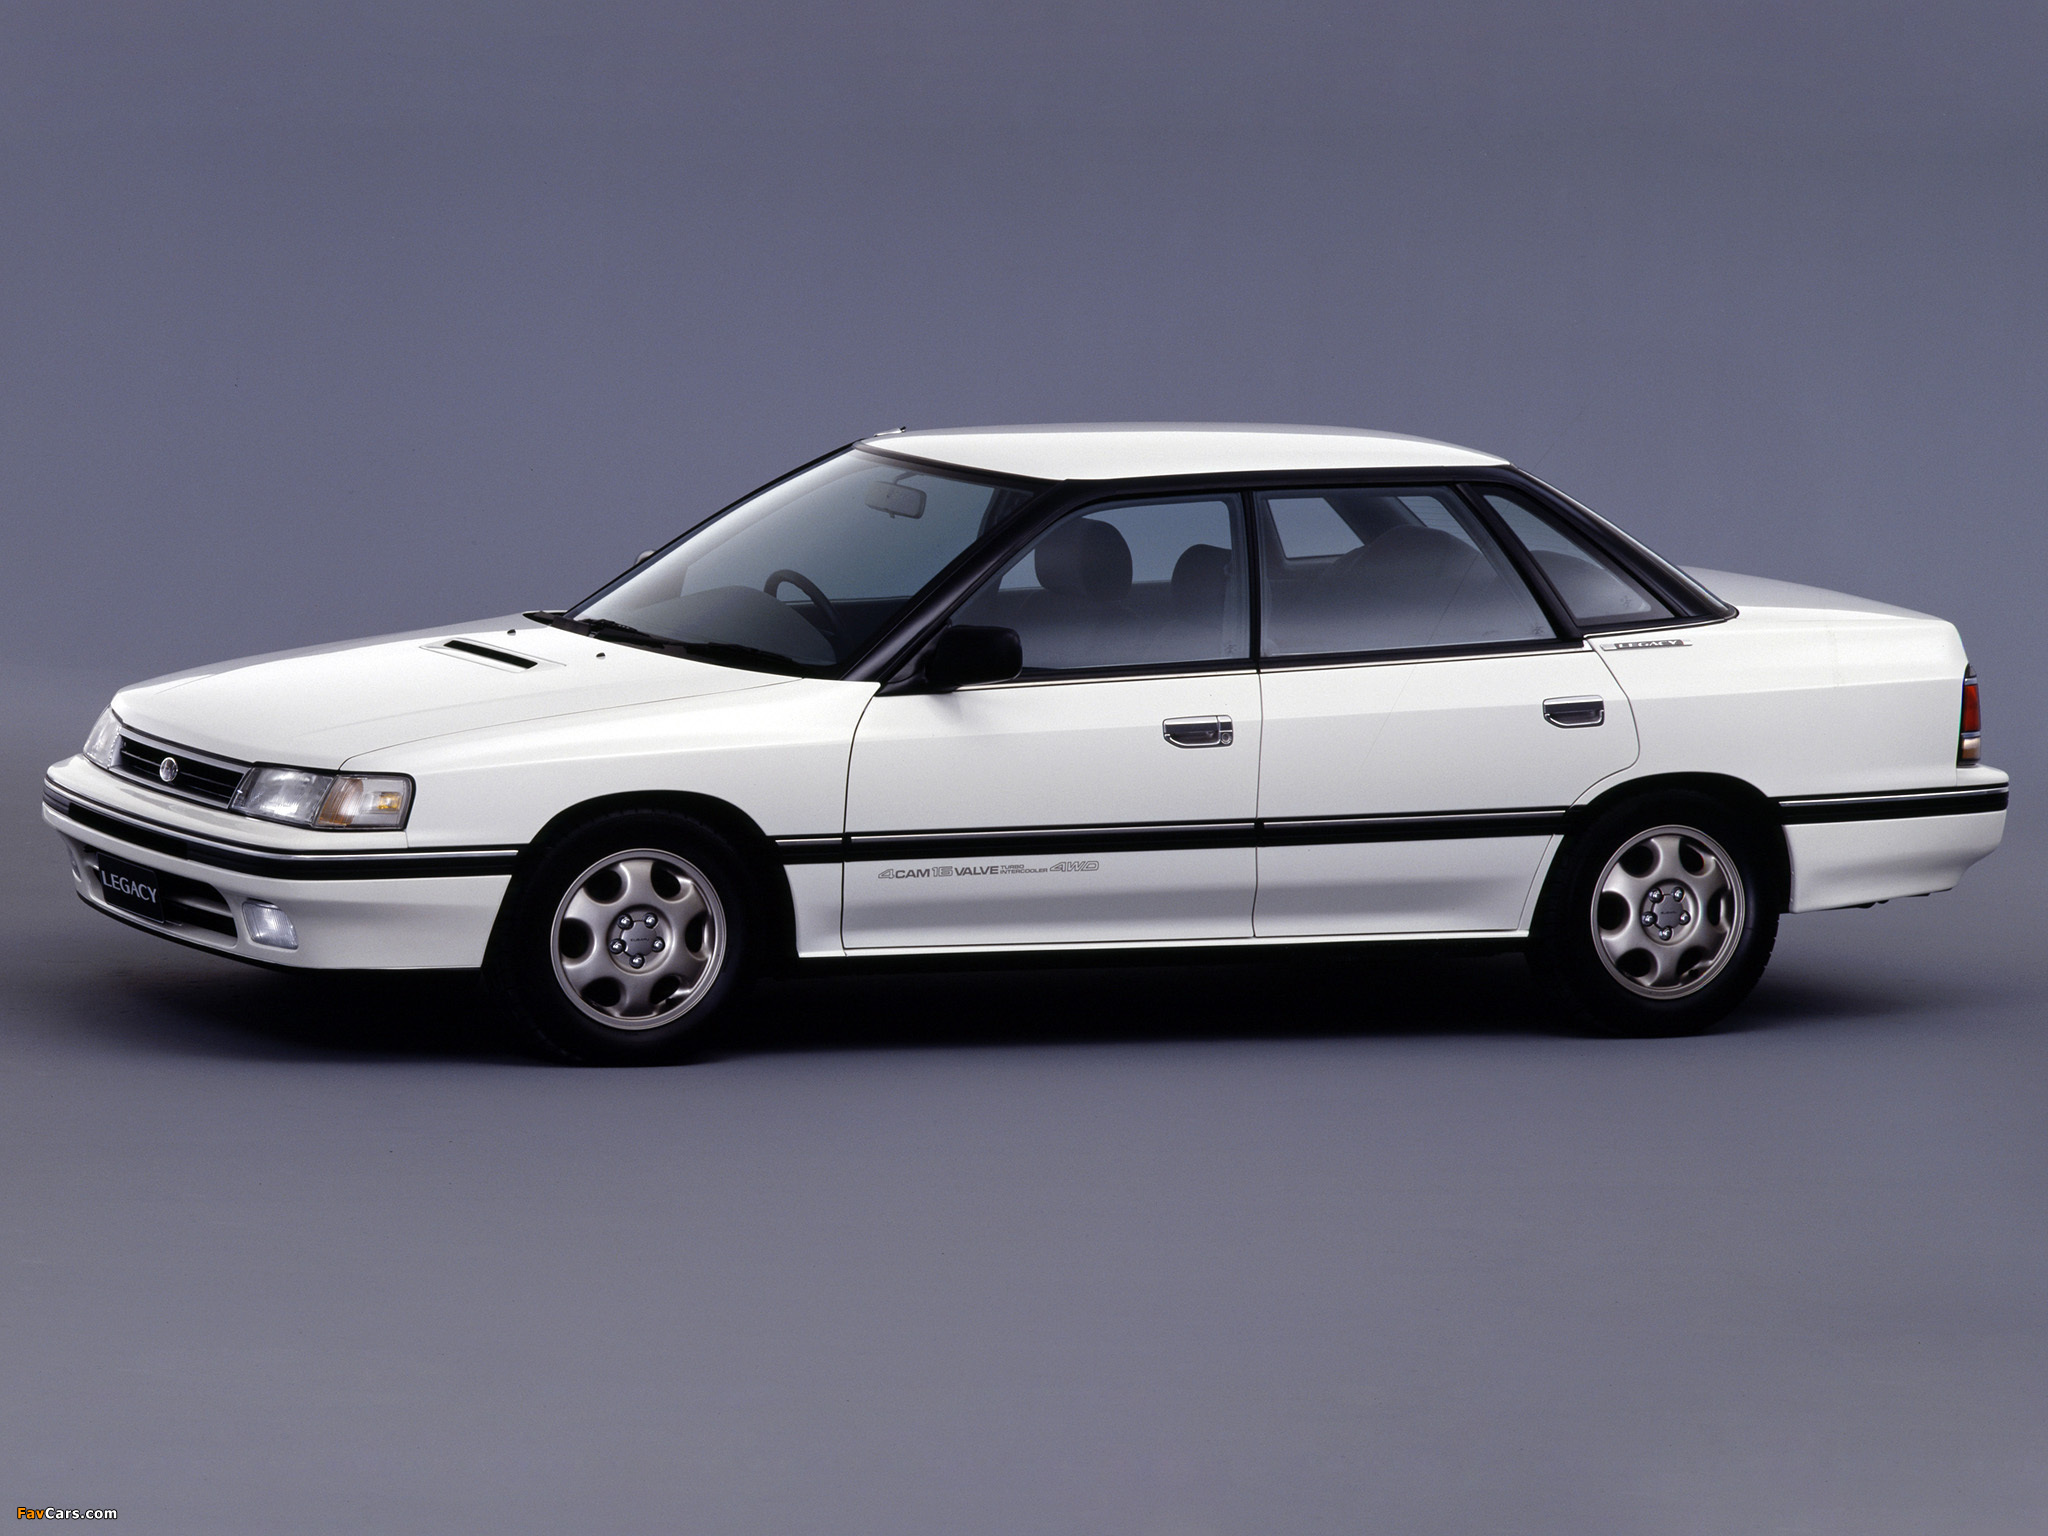
Subaru Legacy RS
1989–1993
—
Market value · recent verified sales
Price History
No verified sales for this car in United Kingdom yet. Our sources are indexing more results — try switching market with the toggle, or check back soon.
MSRP
—
Collectibility
6/10
Collectible
3-Year Forecast
£0
+10%
5-Year Forecast
£0
+13%
Market scores
30
Desirability
Illiquid
10
Liquidity
Moderate
50
Resale Outlook
Marque analyst note
The Subaru Legacy RS occupies a nascent position in the UK classic market, classified as an appreciating classic with a collectibility score of 6 but hampered by minimal transaction data that prevents establishing a reliable current valuation or recent price direction.
Liquidity remains severely constrained, with no tracked sales over the past 12 months and zero active listings at present, creating significant friction for both buyers seeking examples and sellers attempting to move inventory. This illiquid environment means that pricing discovery is difficult and any transaction that does occur may not reflect broader market consensus.
Desirability is currently classified as low, which aligns with the scarcity of market activity and suggests the model has not yet captured sustained collector interest in the UK. Without production volume data or historical transaction history, it is difficult to assess what factors might be driving the limited appeal or what could shift demand going forward.
The base projections suggest modest upward pressure over the medium term, with the model expected to appreciate approximately 9.5 percent over three years and 12.8 percent over five years. These gains are typical for appreciating classics in early market development phases and likely reflect broader automotive nostalgia rather than model-specific momentum.
Prospective participants should treat this market as exploratory and illiquid; any purchase price should be validated against alternative comparable data sources, and exit timing cannot be assumed to follow conventional auction or dealer cycles given the absence of established trading patterns.
Depreciation Benchmark
- Segment average+3.0 to +9.5%/yr
Est. Annual Ownership Costs
- Insurance (agreed value)£450
- Maintenance£900
- Storage£2,400
- Depreciation— (appreciating)
- Total annual cost£3,750
Analyze a listing
Found one for sale? Get an instant verdict.
Enter the ask price (and mileage, if you have it) for an instant read against verified market data.
Not enough verified sales for this model yet to score a listing.
Market Liquidity
- Active Listings0
- Sales Last 12 Months0
Market Snapshot
- Active Listings0
- Avg Sale Price—
- Avg Mileage at Sale—
- Recent Price Range—
- Total Sales Tracked0
Recent sales
Indicative only — not investment advice. Past performance is not a reliable indicator of future value.