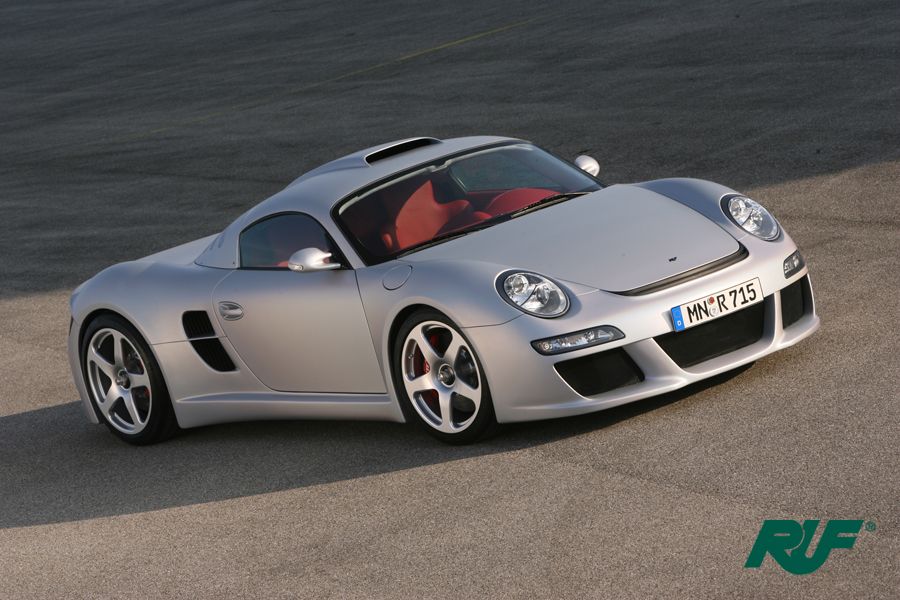
RUF CTR3
2007–2012
—
Market value · recent verified sales
Price History
No verified sales for this car in United Kingdom yet. Our sources are indexing more results — try switching market with the toggle, or check back soon.
MSRP
—
Collectibility
10/10
Holy Grail
3-Year Forecast
£0
+16%
5-Year Forecast
£0
+21%
Market scores
30
Desirability
Illiquid
10
Liquidity
Moderate
50
Resale Outlook
Marque analyst note
The RUF CTR3 remains one of the most exclusive modern performance cars ever built, with only 30 units produced worldwide, placing it firmly in the "Holy Grail" collectibility tier. No UK sales have been tracked over the past 12 months, reflecting the car's extreme rarity and illiquid market status.
The absence of transaction data means current pricing cannot be established with confidence. This thin trading environment is typical for ultra-low-production specialist vehicles where buyers and sellers rarely intersect on the open market.
The CTR3's desirability classification as "Low" relative to broader market interest is noteworthy and likely reflects its positioning as a manufacturer-specific, niche product rather than a mass-appeal collectible. Despite this, its production scarcity and technical significance ensure it maintains appeal among a small, dedicated collector base.
Over the next three years, baseline projections suggest appreciation of approximately 15.5 percent, with five-year expectations rising to 21.0 percent. These modest gains reflect the fundamental scarcity of the model and its established status as a collectible, though without active transaction evidence, these forecasts carry limited predictive weight.
For potential market participants, the practical challenge remains locating a willing seller; zero active listings underscore the reality that acquisition opportunities are determined more by private networks and specialist dealer relationships than conventional auction or dealer channels. Any UK valuation should draw heavily on European comparable sales where transaction activity, though equally sparse, may provide pricing reference points.
Depreciation Benchmark
- Segment average+3.0 to +9.5%/yr
Est. Annual Ownership Costs
- Insurance (agreed value)£450
- Maintenance£900
- Storage£2,400
- Depreciation— (appreciating)
- Total annual cost£3,750
Analyze a listing
Found one for sale? Get an instant verdict.
Enter the ask price (and mileage, if you have it) for an instant read against verified market data.
Not enough verified sales for this model yet to score a listing.
Market Liquidity
- Active Listings0
- Sales Last 12 Months0
Market Snapshot
- Active Listings0
- Avg Sale Price—
- Avg Mileage at Sale—
- Recent Price Range—
- Total Sales Tracked0
Recent sales
Indicative only — not investment advice. Past performance is not a reliable indicator of future value.