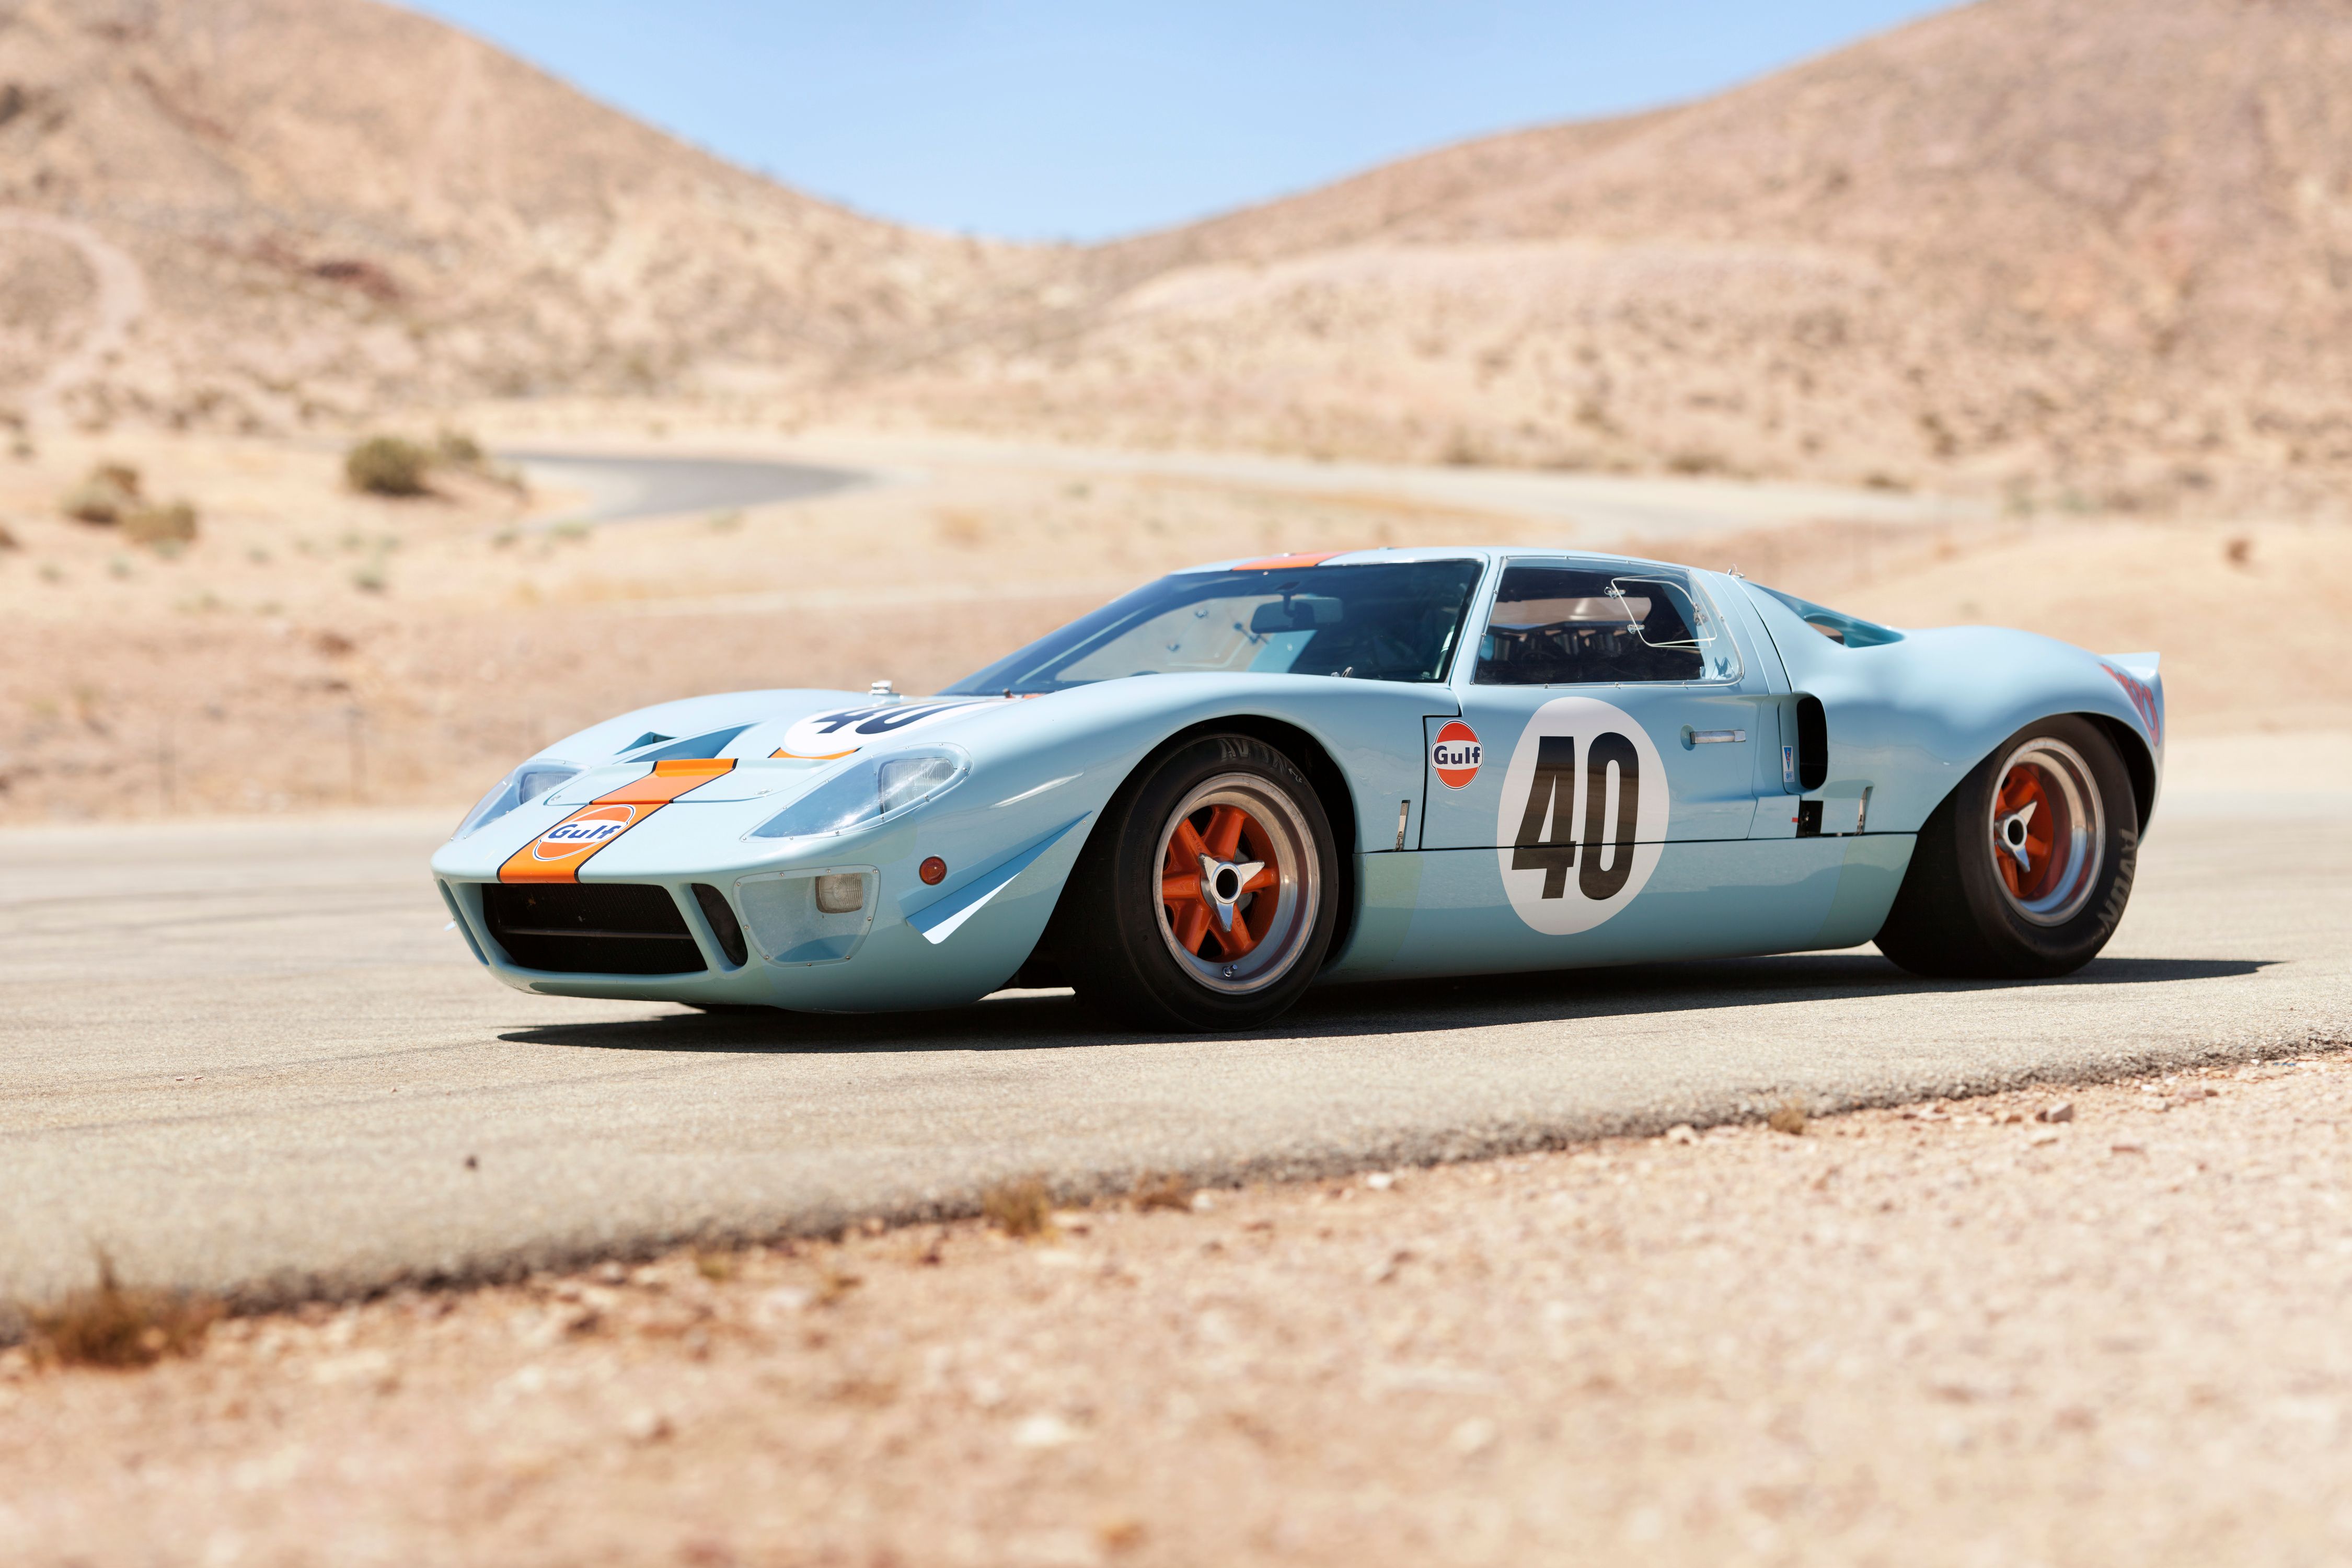
Ford GT40
1964–1969
—
Market value · recent verified sales
Price History
No verified sales for this car in United Kingdom yet. Our sources are indexing more results — try switching market with the toggle, or check back soon.
MSRP
—
Collectibility
6/10
Collectible
3-Year Forecast
£0
+10%
5-Year Forecast
£0
+13%
Market scores
30
Desirability
Illiquid
10
Liquidity
Moderate
50
Resale Outlook
Marque analyst note
The Ford GT40 remains one of the most historically significant competition cars ever built, yet the UK market presents a curious gap in recent transaction data. With no recorded sales in the past twelve months and no active listings, establishing current market value is impossible; this absence itself signals either exceptionally low turnover or vehicles held firmly by long-term collectors unwilling to part with them.
Classified as an appreciating classic with a collectibility score of 6, the GT40 occupies a rarefied tier of the market where provenance, racing history, and originality drive desirability far more than mechanical condition or mileage. The illiquid designation reflects the reality that these cars trade infrequently and often through private channels or specialist brokers rather than conventional auction houses, making transparent pricing difficult to establish.
The projection models suggest cumulative appreciation of 9.5 percent over three years and 12.8 percent over five years on a baseline, though without recent transactions to anchor these figures, such estimates carry limited confidence. Any recovery or advance will depend almost entirely on the broader collector-car market's health and the specific significance of individual examples—works cars and competition history command premiums that standard road cars cannot match.
For prospective buyers or holders, the lack of liquidity means that exit strategy should be planned carefully and timely, particularly given that GT40s of investment grade require specialist knowledge to transact and may demand patience to find the right buyer at the right price.
Depreciation Benchmark
- Segment average+3.0 to +9.5%/yr
Est. Annual Ownership Costs
- Insurance (agreed value)£450
- Maintenance£900
- Storage£2,400
- Depreciation— (appreciating)
- Total annual cost£3,750
Analyze a listing
Found one for sale? Get an instant verdict.
Enter the ask price (and mileage, if you have it) for an instant read against verified market data.
Not enough verified sales for this model yet to score a listing.
Market Liquidity
- Active Listings0
- Sales Last 12 Months0
Market Snapshot
- Active Listings0
- Avg Sale Price—
- Avg Mileage at Sale—
- Recent Price Range—
- Total Sales Tracked0
Recent sales
Indicative only — not investment advice. Past performance is not a reliable indicator of future value.