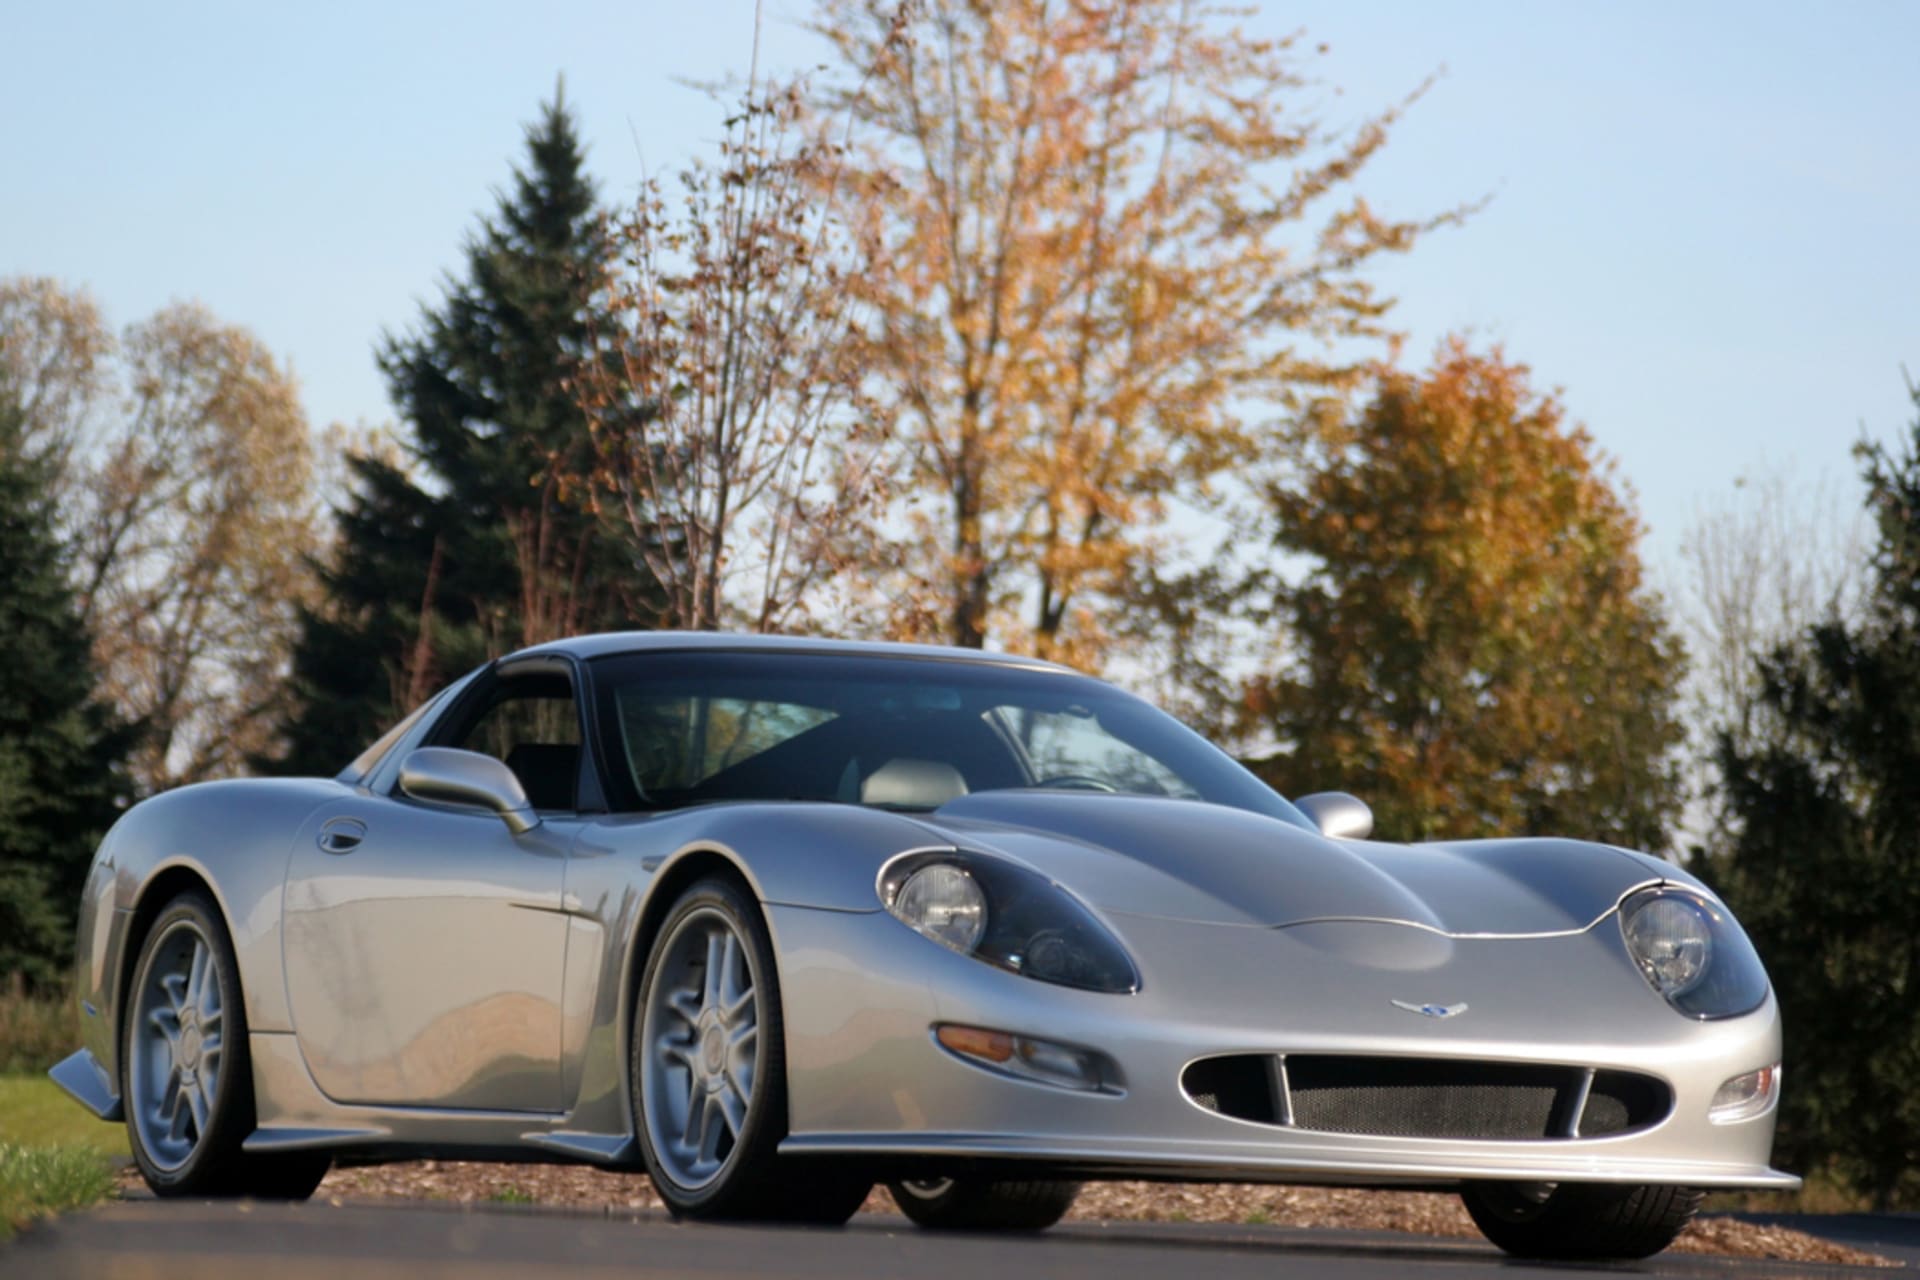
Callaway C12
1998–2002
—
Market value · recent verified sales
Price History
No verified sales for this car in United Kingdom yet. Our sources are indexing more results — try switching market with the toggle, or check back soon.
MSRP
—
Collectibility
10/10
Holy Grail
3-Year Forecast
£0
+16%
5-Year Forecast
£0
+21%
Market scores
30
Desirability
Illiquid
10
Liquidity
Moderate
50
Resale Outlook
Marque analyst note
The Callaway C12 occupies a peculiar position in the UK market: it carries a "Holy Grail" collectibility score despite recording zero sales tracked over the past twelve months and no current market pricing data. This absence of transaction history makes valuation assessment impossible at present, though the car's extreme rarity—only 19 units produced globally—suggests any future sale would command significant attention.
Liquidity is effectively non-existent, with no active listings and no recorded sales in our tracking window. This illiquidity is typical for cars of this caliber and production volume; when they do trade, they tend to move through private negotiation or specialist dealers rather than public auction channels. Potential buyers should expect lengthy search periods and limited leverage in price discovery.
The C12's classification as an appreciating classic reflects its hand-built American provenance and engineering significance, even as current desirability registers as low—likely a symptom of invisibility in the market rather than collector indifference. The extremely small production run ensures that supply-side scarcity will remain a permanent feature, supporting any future appreciation trajectory.
Without recent transaction data or comparable pricing, projections carry limited reliability, though the modeled base case suggests 15.5% appreciation over three years and 21% over five years. These estimates rest on the car's rarity tier and appreciating-classic classification rather than empirical recent market movement, so actual results could vary substantially depending on when and where the next example surfaces for sale.
Depreciation Benchmark
- Segment average+3.0 to +9.5%/yr
Est. Annual Ownership Costs
- Insurance (agreed value)£450
- Maintenance£900
- Storage£2,400
- Depreciation— (appreciating)
- Total annual cost£3,750
Analyze a listing
Found one for sale? Get an instant verdict.
Enter the ask price (and mileage, if you have it) for an instant read against verified market data.
Not enough verified sales for this model yet to score a listing.
Market Liquidity
- Active Listings0
- Sales Last 12 Months0
Market Snapshot
- Active Listings0
- Avg Sale Price—
- Avg Mileage at Sale—
- Recent Price Range—
- Total Sales Tracked0
Recent sales
Indicative only — not investment advice. Past performance is not a reliable indicator of future value.