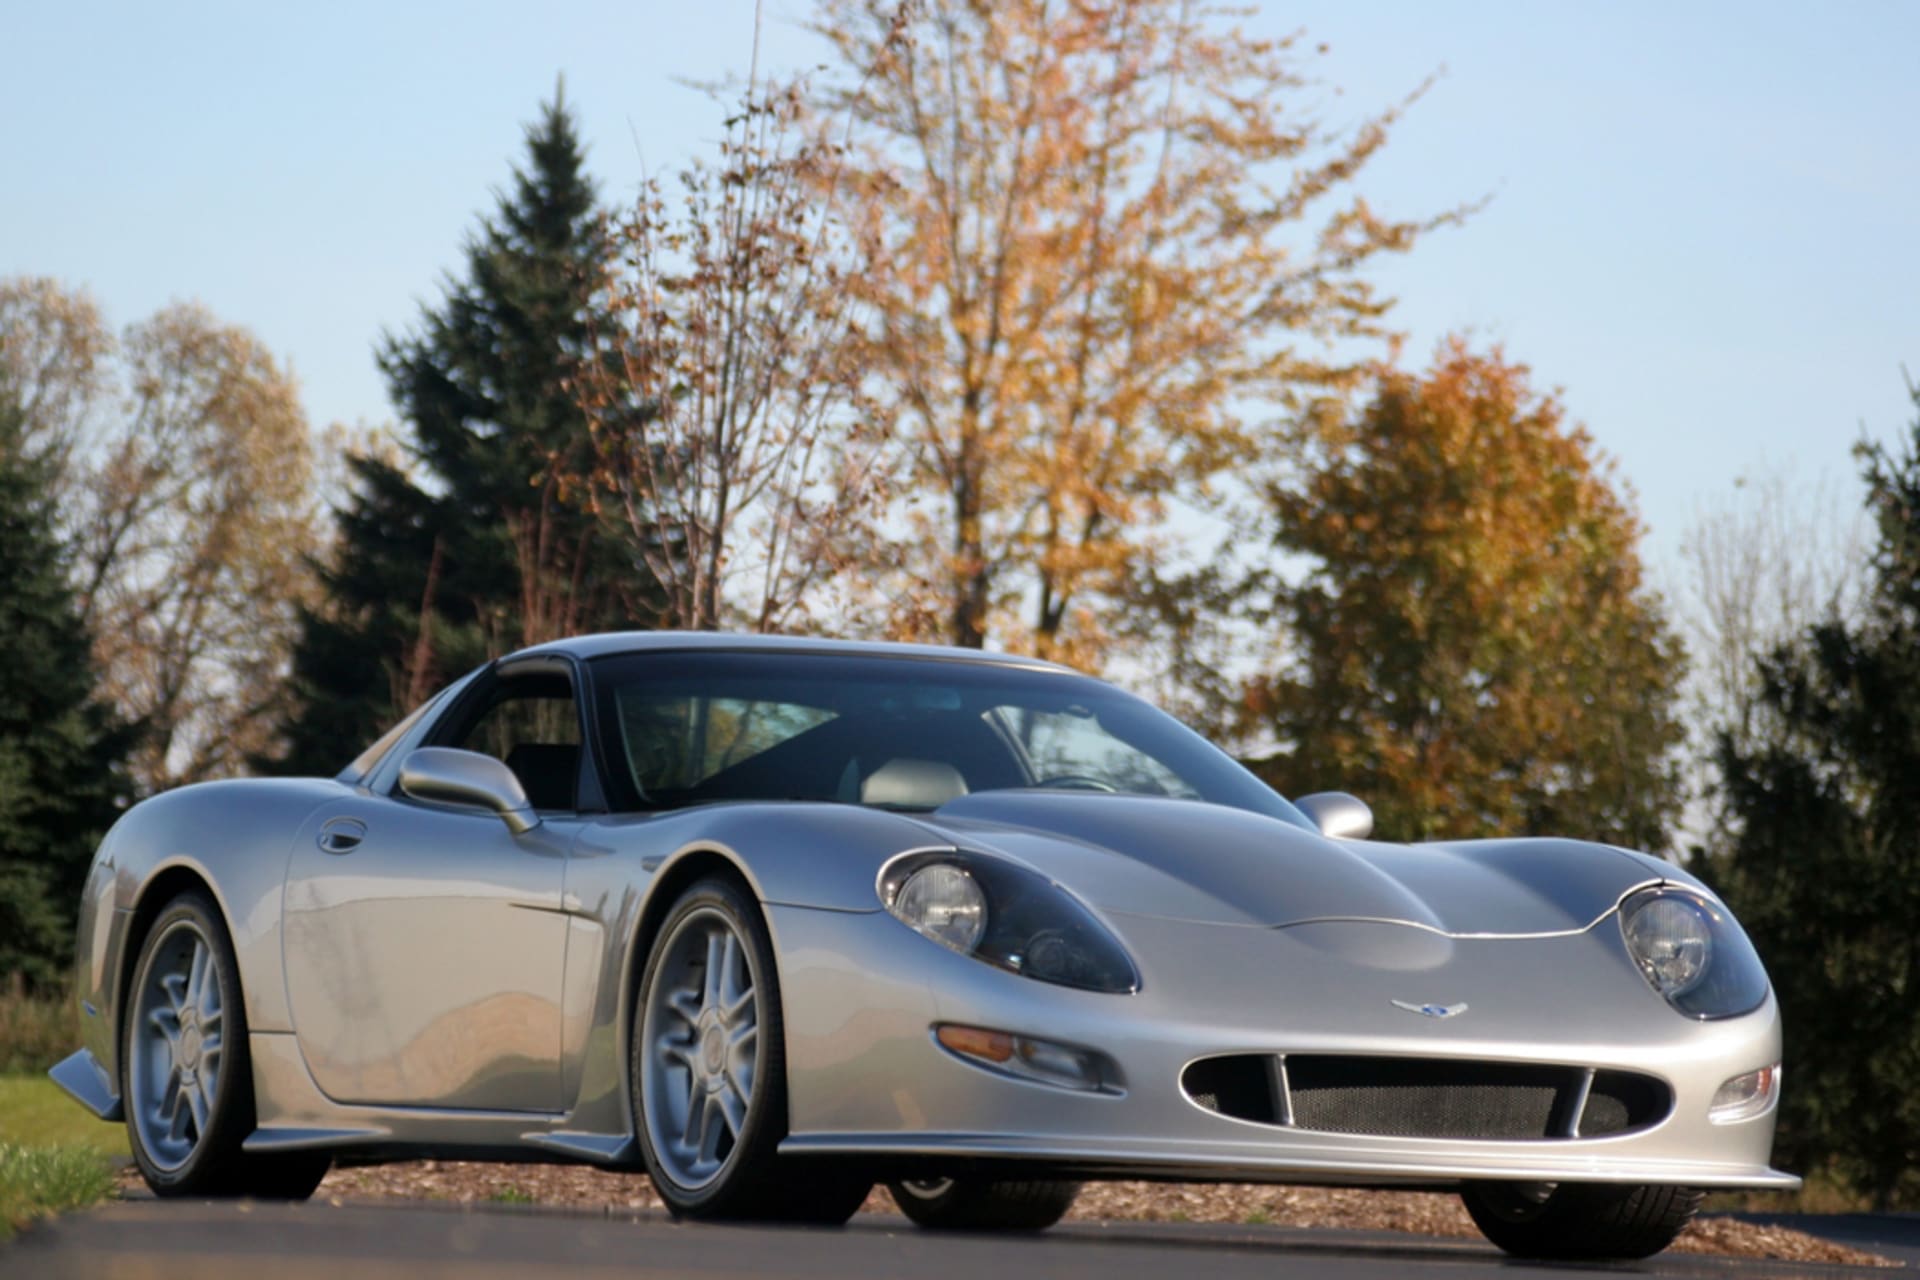
Callaway C12
1998–2002
—
Market value · recent verified sales
Price History
No verified sales for this car in United States yet. Our sources are indexing more results — try switching market with the toggle, or check back soon.
MSRP
—
Collectibility
10/10
Holy Grail
3-Year Forecast
US$0
+16%
5-Year Forecast
US$0
+21%
Market scores
30
Desirability
Illiquid
10
Liquidity
Moderate
50
Resale Outlook
Marque analyst note
The Callaway C12 remains one of the rarest modern collectibles, with only 19 examples produced, placing it firmly in Holy Grail territory for institutional collectors. No transacted sales were tracked over the past twelve months, reflecting the extreme illiquidity that characterizes this segment of the market.
The absence of recent comparable sales makes price discovery impossible and underscores the speculative nature of ownership. Prospective buyers should expect to negotiate privately and accept wide bid-ask spreads, as public market signals are simply unavailable for this model.
Despite illiquid trading conditions, the Callaway C12's collectibility score of 10 reflects its singular production history and technical significance as a hand-built, limited-edition American supercar. The model's rarity alone sustains baseline collector interest, even in the absence of robust secondary-market activity.
Model-year projections suggest a base case appreciation rate of 15.5 percent over three years and 21.0 percent over five years, though these figures should be treated as directional guidance only given the absence of recent transaction data to calibrate confidence intervals. Any pricing movement will likely depend on broader economic conditions affecting ultra-high-net-worth collector demand rather than on supply-side scarcity alone.
Dealers and auction houses with access to C12 inventory should treat each opportunity as a singular event rather than rely on historical precedent. The car's low desirability rating, despite its Holy Grail status, suggests that even rarity cannot guarantee rapid monetization in a market starved for comparable transactions.
Depreciation Benchmark
- Segment average+3.0 to +9.5%/yr
Est. Annual Ownership Costs
- Insurance (agreed value)US$450
- MaintenanceUS$900
- StorageUS$2,400
- Depreciation— (appreciating)
- Total annual costUS$3,750
Analyze a listing
Found one for sale? Get an instant verdict.
Enter the ask price (and mileage, if you have it) for an instant read against verified market data.
Not enough verified sales for this model yet to score a listing.
Market Liquidity
- Active Listings0
- Sales Last 12 Months0
Market Snapshot
- Active Listings0
- Avg Sale Price—
- Avg Mileage at Sale—
- Recent Price Range—
- Total Sales Tracked0
Recent sales
Indicative only — not investment advice. Past performance is not a reliable indicator of future value.